Difference between revisions of "Heat Maps"
Jump to navigation
Jump to search
m |
|||
| Line 14: | Line 14: | ||
</div> | </div> | ||
[[Category: User Interface | [[Category: User Interface Engineering]] | ||
Latest revision as of 10:36, 17 May 2011
| APPLICATION AREAS |
|---|
|
|
| PROJECTS |
|
Research- and Metadata Handling Corporate & Interface Design (under Rework) |
| edit |
Software based Evaluation
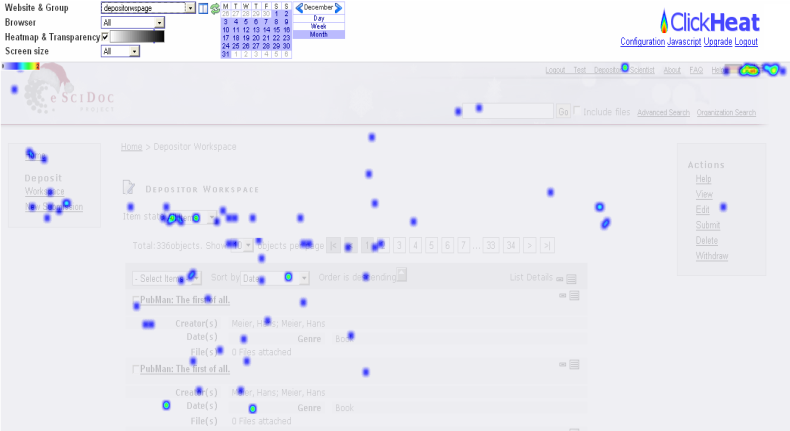
Currently the pubman prototype is monitored by an open source application called ClickHeat. This solution generates pictures called heat maps. Heat maps show where users click (dots) and how often (colour).
Example:

Heat Map of Depositor Workspace
Software based evaluation is not conducted for R3. Currently no open source application is available for analysing dynamic pages.